
Approaches to assessing commodity-driven deforestation
An explanation of two different methods used by Trase and Pendrill et al (2022) to assess deforestation linked to agricultural commodity production.
14 Jun 2022
Chris West
Photo credit: Soy plantation // Marizilda Cruppe
Understanding the role that agriculture plays in deforestation is complex. To do so accurately, one must be able to link high-resolution land-use change data to the production and trade of specific crops.
Trase’s pioneering work supports this understanding through a combination of state-of-the-art geospatial information and detailed knowledge of land-use dynamics. While not perfect, Trase’s deforestation risk information has been important in helping stakeholders understand how commodity supply chains are implicated in driving deforestation.
However, because Trase data depends on the availability of detailed supply chain information, it is only available for certain countries and commodities. These cover some of the most important landscapes of production linked to deforestation, but by no means all.
For this reason, Trase research – such as our new report for the German Agency for International Cooperation (GIZ) – also uses national scale deforestation risk data provided by Pendrill et al (2022), alongside national trade records, to provide assessments of the broader landscape of international trade-linked deforestation.
While the two approaches both link deforestation to crop production, they have important differences which should be understood when interpreting their findings.
Trase deforestation data
Trase provides information for a given location of production through to the port of export and country of first import (Figure 1). Trase's commodity deforestation risk indicator estimates the exposure of an actor (company or country) to the risk of sourcing a specific commodity from a recently deforested area.
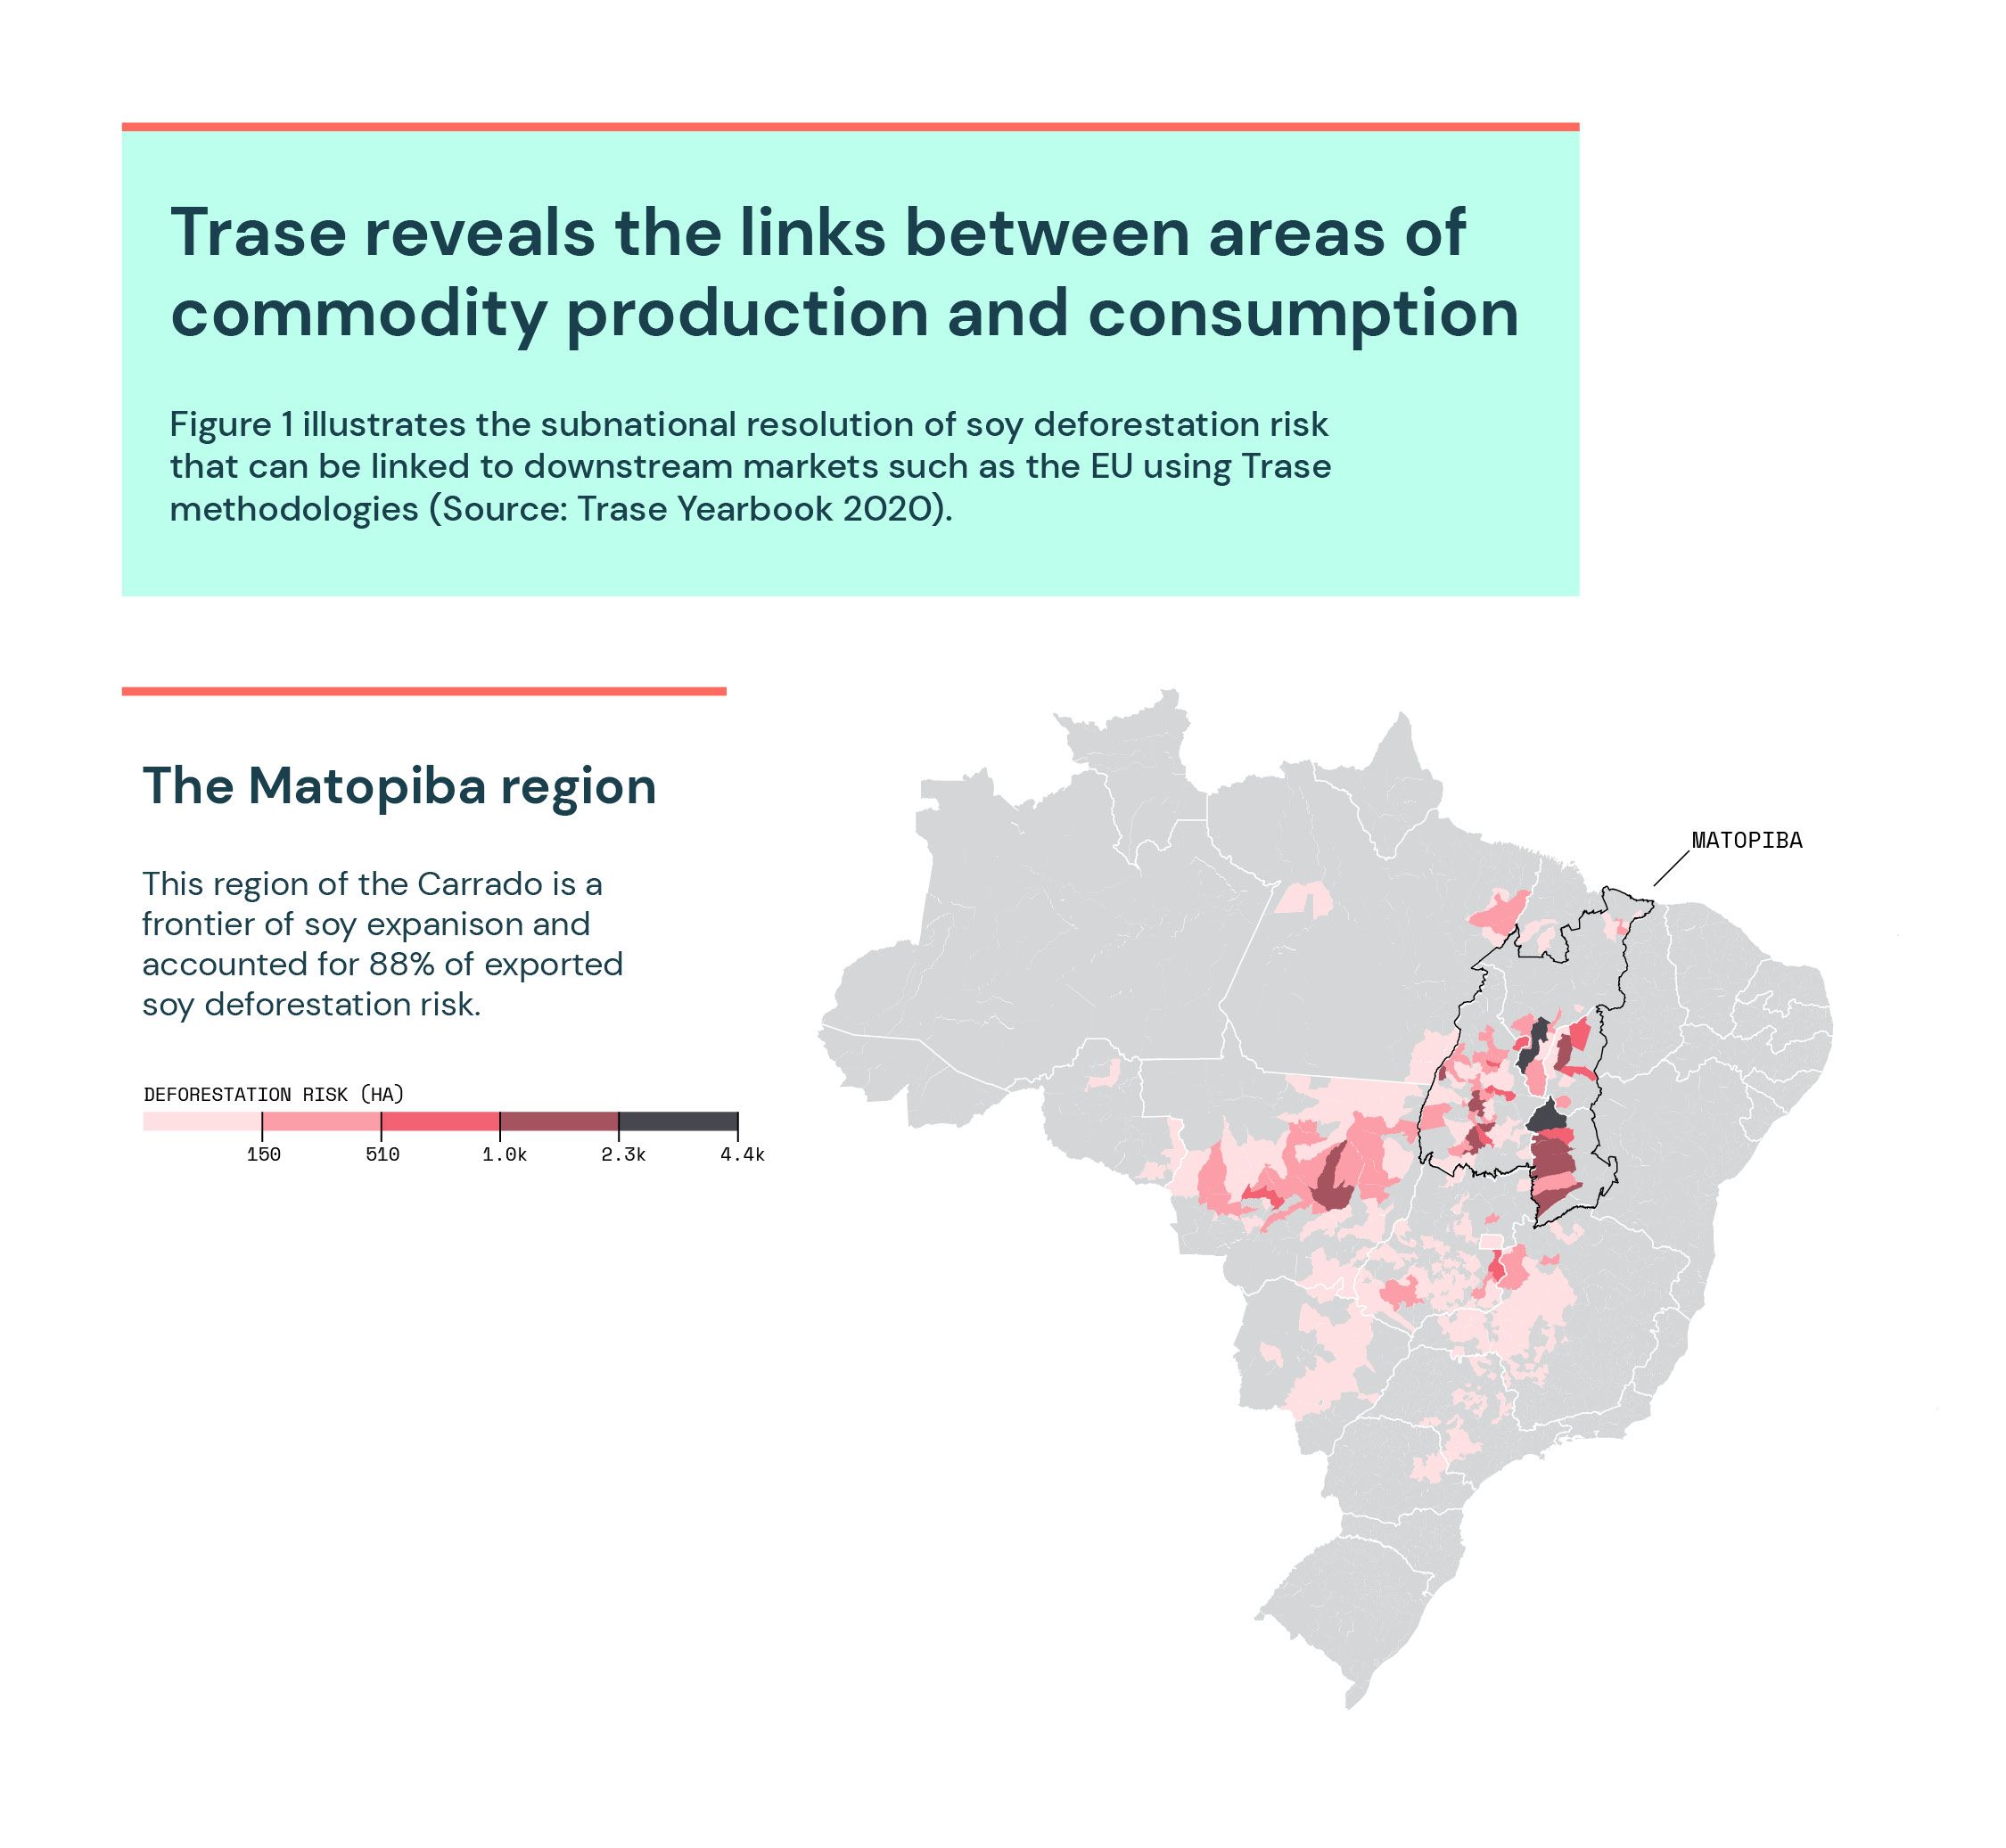
(Source: Trase Yearbook 2020).
Trase’s commodity deforestation indicator captures how much of a defined area (obtained via satellite imagery) used to produce a particular commodity overlaps with areas that have been recently deforested. The parameter used to decide which years of deforestation are included in the analysis is termed the ‘allocation period’. This accounts for the period of time over which deforestation is likely to have been caused by the target commodity.
This allocation period varies depending on the commodity; for example, in South America, we use an allocation period of five years for soy, meaning that soy production can have been the driver for deforestation five years earlier, and therefore that deforestation in one year can be attributed to soy production and export occurring five years later. A one-year lag is also applied to account for the necessary gap between deforestation and the first potential harvest of soy.
Different dynamics apply in the production of beef, so our beef deforestation risk data accounts for five years of potential pasture grazing that might be used to rear cattle, plus five years of deforestation associated with pasture creation aligned to each one of the annual pasture maps. We do not include a lag period for beef production because animal rearing can take place soon after deforestation. For more details on the methods and specific allocations used for each Trase country/commodity context, see the Methods section of trase.earth.
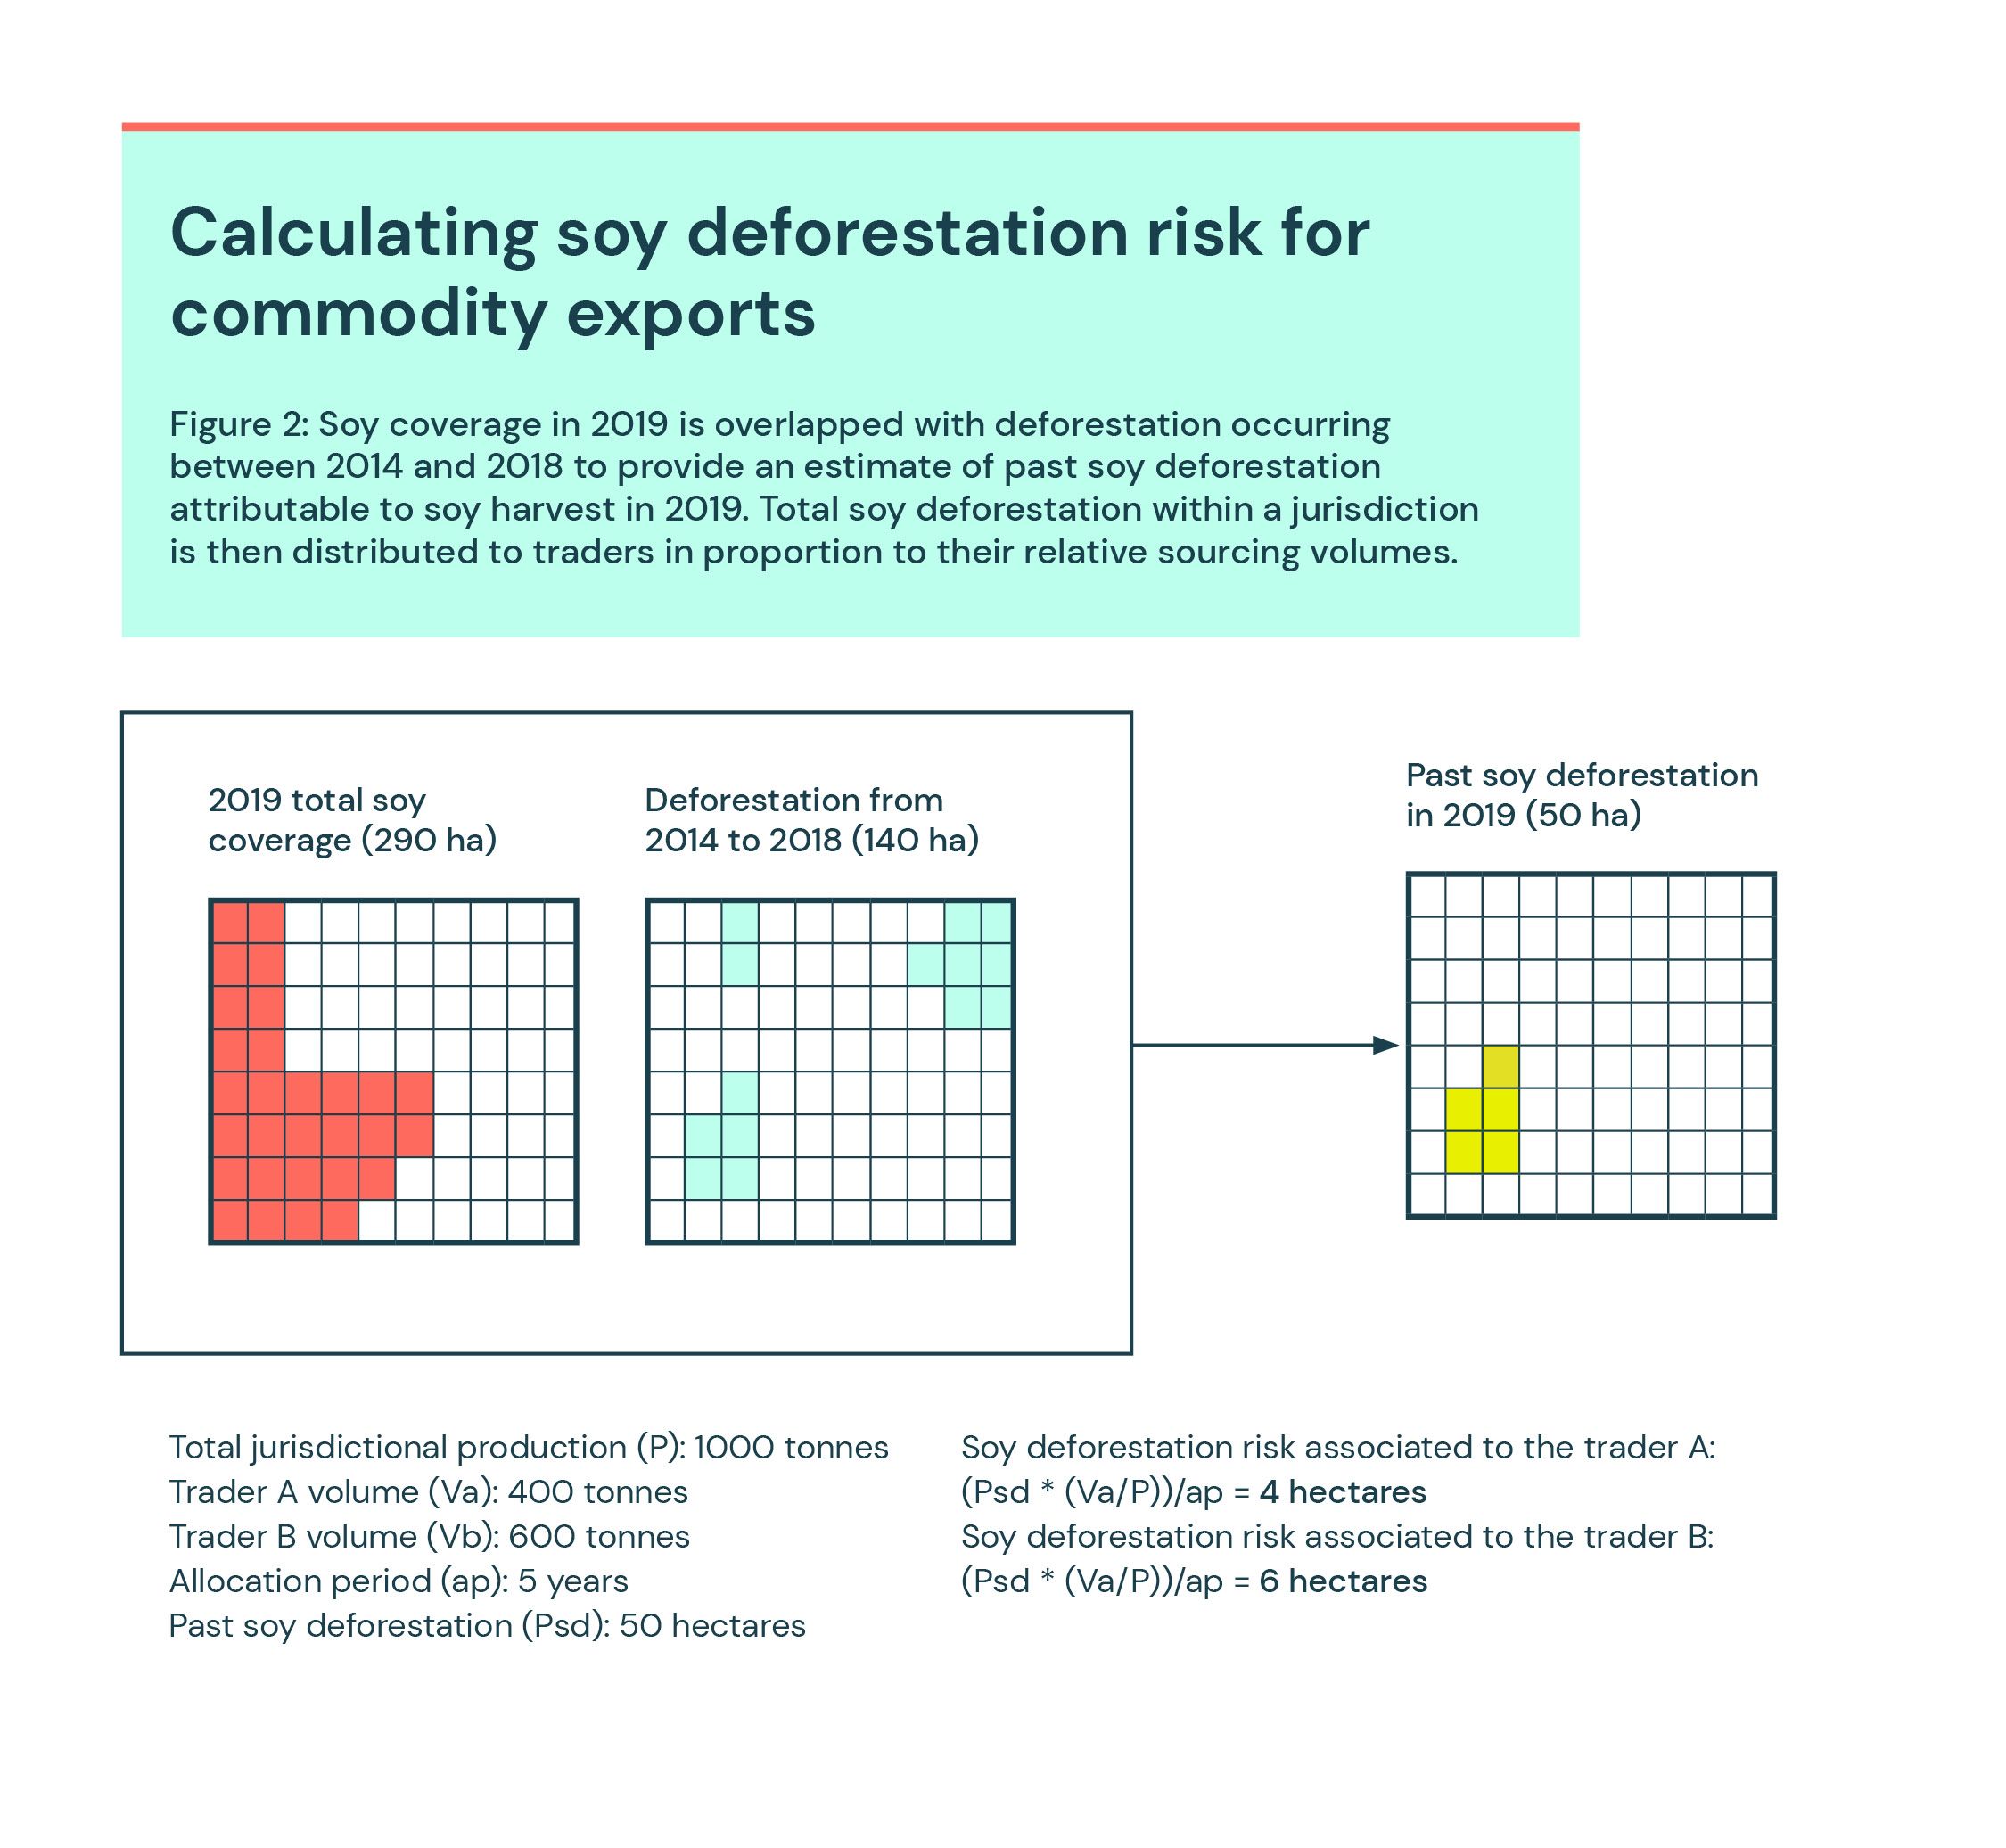
Figure 2 (below) illustrates the application of allocation periods and lag periods in the case of South American soy exports. For soy produced in 2019, we look backward in time and link it to deforestation that occurred anytime between 2014 and 2018, inclusive. The one-year lag period determines the gap between the last possible deforestation event (2018) and the soy harvested in 2019 (i.e. no deforestation within a harvest year is associated with production in that same harvest year).
Trase aggregates total deforestation at the subnational jurisdiction level, before sharing it among actors in the supply chain associated with a given year’s exports. Each actor’s share of this deforestation – their ‘deforestation risk’ – is directly proportional to that actor’s share of total commodity production per jurisdiction, by volume.
In adopting multi-year allocation periods we have to consider how to associate deforestation to production and exports occurring over several years. For example, a deforestation event occurring in 2014 may be associated with soy production and export in 2019, but - due to the five-year allocation period – also to soy exported in 2018, 2017, 2016 and 2015. Summing the same deforestation allocated to soy exports from a single parcel of land across multiple years would return a larger area than that initially deforested (five times larger in this example).
If the objective is to compare changes in deforestation risk associated with soy exports over time – a common use of Trase data – then it makes more sense to spread the initial deforestation event over the full allocation period and therefore avoid double counting deforestation across export years. To do this, Trase annualises the deforestation risk for each year and each region by dividing the total deforestation by the allocation period (i.e. five years in the case of soy in South America).
As Figure 2 illustrates, Trase’s approach relies on two spatially explicit datasets; a spatially explicit measure of deforestation (or other land-use change) and a dataset that indicates which commodity is produced. Trase tries to use the best available data for each of its regions of production. For Brazilian soy, for example, the extent of soy (at 30m resolution) is derived from data from the Global Land Analysis & Discovery (GLAD) group at the University of Maryland. Trase deforestation data (also at 30m resolution) is derived from Prodes, SOS-Mata Atlantica and SOS-Pantanal sources. A full list of information sources is available in the Methods section of trase.earth.
Pendrill et al. 2022 deforestation data
For national scale risk assessments, Trase uses the 2022 dataset on tropical and subtropical deforestation created by Florence Pendrill at Chalmers University of Technology in Sweden and colleagues (Pendrill et al, 2022). This peer reviewed, openly available set of data is a respected resource for assessing deforestation linked to agricultural production.
Figure 3 (below) provides a workflow of the data sources and methods used to compile this resource. Observed forest loss, from GLAD satellite data, is attributed to agricultural and timber commodities using a simple land-balance model implemented at national scale. In this land-balance model, cropland expansion (from FAOStat) first occurs on pastures (in cases where there is gross pasture loss), and then into forests (where there is gross forest loss), an assumption which is deemed to robustly reflect typical tropical landscape dynamics.
In essence, forest loss is attributed across expanding cropland, pasture and managed forest plantations based on their area increase, but capped at total estimated forest loss in the focal region. Forest loss attributed to forest plantations is attributed to ‘wood products (forest plantations)’. Forest loss attributed to cropland expansion is further attributed to individual crops or crop groups in proportion to their relative expansion in the harvested area. Although attribution usually takes place at national scale using FAO data (which may vary in its accuracy across commodities, places of production and over time), for Brazil and Indonesia, regional detail at subnational level is used, but with results being aggregated to national scale. Forest loss attributed to pasture is linked to cattle grazing for meat and leather production.
Importantly, while data on forest loss is spatially specific (as it is derived from satellite imagery), attribution to individual crops is conducted on a non-spatial basis, in accordance with a record of the size of planted areas. Thus, the physical presence or absence of crops in regions previously covered by forest is not explicitly assessed. A lack of information on the physical location and/or expansion of specific crops at global scales prevents such an assessment.
Along with the national (as opposed to subnational) scale of analysis and a lack of spatially explicit linkage to crop distributions, a further difference is the time lag and attribution steps adopted by Pendrill compared to Trase.
Because of observed time lags between deforestation and agricultural production, Pendrill averages changes in the area of cropland, pastures and crop groups over a period of three years following forest loss. Furthermore, to reflect the fact that the productive use of land for commodity production occurs for several years after forest conversion, the deforestation attributed to a given land use is spread equally over production from that land in the five years following the deforestation event. In other words, both Trase and Pendrill account for allocation periods and timelags in their approaches, but they do so with different assumptions.
Pendrill provides deforestation risk statistics per FAO primary commodity (e.g. crop). This can be used alongside production and trade information, also from FAO, to attribute tropical and subtropical deforestation risk to the supply chains of important commodities. Several approaches are available to do this from alternative trade perspectives, as described in this Trase Explainer.
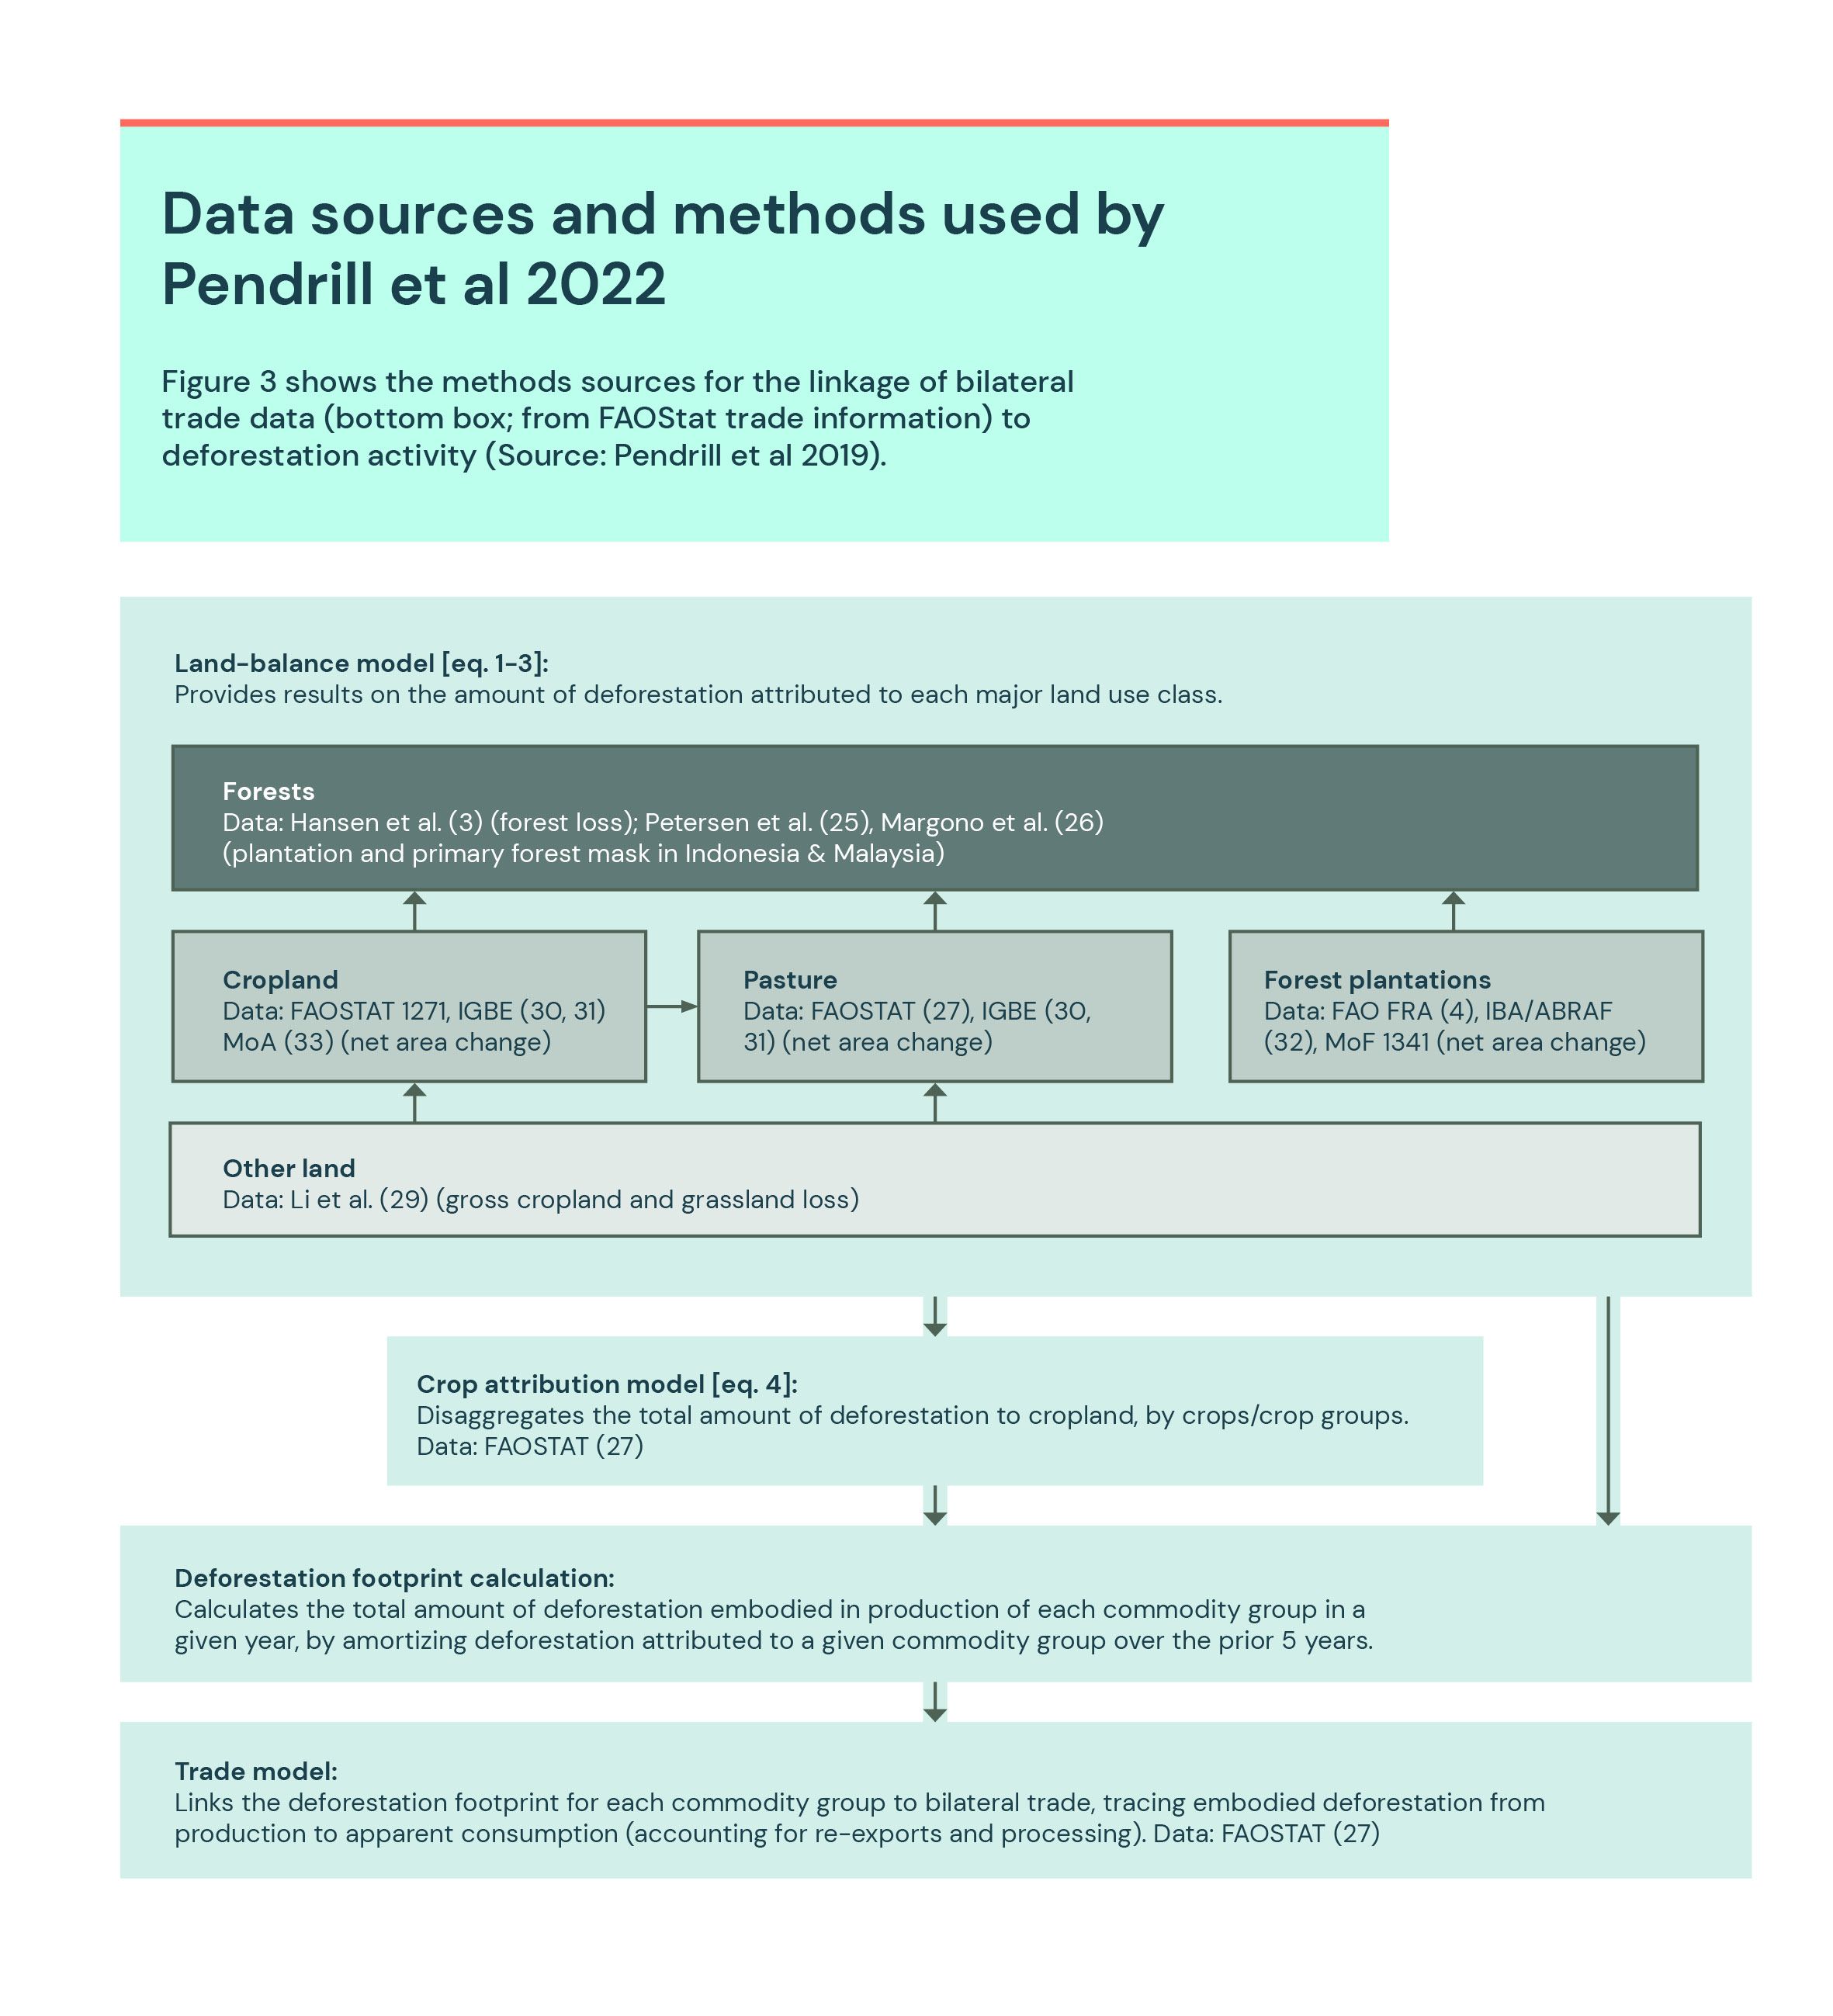
(Source: Pendrill et al 2019).
Making comparisons across methods
The differences between these two methods make it difficult to draw direct comparisons between data derived from them. The method adopted by Trase should provide a more accurate, but also more conservative, assessment of deforestation risk than that provided by the Pendrill data. This is because Trase uses subnational, spatially explicit crop information for its contexts, whereas Pendrill relies on non-spatial attribution – usually at national level.
Uncertainties in the Pendrill dataset will be particularly apparent for large countries of production, such as Australia, where the non-spatial approach means that many crops will be associated with deforestation risk while not necessarily being grown themselves in deforestation frontiers. The key use of the Pendrill dataset is not in being able to compare results with Trase data, but in undertaking deforestation risk assessments across those areas which Trase does not cover, and in being able to carry out global risk assessments with a standard approach across the international trade system as a whole.
It should also be noted that neither approach accords directly with the definition of deforestation used in the FAO Forest Resources Assessment, which is likely to be adopted by EU’s proposed regulation on deforestation-free products. Either approach would, however, be amenable to the use of deforestation data derived from products which are aligned with this FAO definition, once aligned satellite imagery products become available.
To find out how these methods are applied in practice, read the Trase research report Assessing tropical deforestation in Germany’s agricultural commodity supply chains


